A/B Testing Instant.Page With Netlify and Speedcurve
This post ended up leading to the discovery of a bug in the way Chrome handles prefetched resources. I’ve written a follow-up post about it, and how it impacted the results of this test.
prefetch resource hint to get started fetching that page before the click event even occurs. I like the idea, in theory, quite a bit. I also like the implementation. The script is tiny (1.1kb with Brotli) and not overly aggressive by default—you can tell it to prefetch all visible links in the viewport, but that’s not the default behavior.
I wanted to know the actual impact, though. How well would the approach work when put out there in the real-world?
It was a great excuse for running a split test. By serving one version of the site with instant.page in place to some traffic, and a site without it to another, I could compare the performance of them both over the same timespan and see how it shakes out.
It turns out, between Netlify and SpeedCurve, this didn’t require much work.
Netlify supports branch-bases split testing, so first up was implementing instant.page on a separate branch. I downloaded the latest version so that I could self-host (there’s no reason to incur the separate connection cost) and dropped it into my page on a separate branch (very creatively called “instant-page”) and pushed to GitHub.
With the separate branch ready, I was able set up a split test in Netlify by selecting the master branch and the instant-page branch, and allocating the traffic that should go to each. I went with 50% each because I’m boring.

I still needed a way to distinguish between sessions with instant.page and sessions without it. That’s where SpeedCurve’s addData method comes into play. With it, I can add a custom data variable (again, creatively called “instantpage”) that either equals “yes” if you were on the version with instant.page or “no” if you weren’t.
<script>LUX.addData('instantpage', 'yes');</script>I could have added the snippet to both branches, but it felt a bit sloppy to update my master branch to track the lack of something that only existed in a different branch. Once again, Netlify has a nice answer for that.
Netlify has a feature called Snippet Injection that lets you inject a snippet of code either just before the closing body tag or just before the closing head tag. Their snippet injection feature supports Liquid templating and also exposes any environmental variables, including one that indicates which branch you happen to be on. During the build process, that snippet (and any associated Liquid syntax) gets generated and added to the resulting code.
This let me check the branch being built and inject the appropriate addData without having to touch either branch’s source:
{% if BRANCH == "instant-page" %}
<script>LUX.addData('instantpage', 'yes');</script>
{% else %}
<script>LUX.addData('instantpage', 'no');</script>
{% endif %}
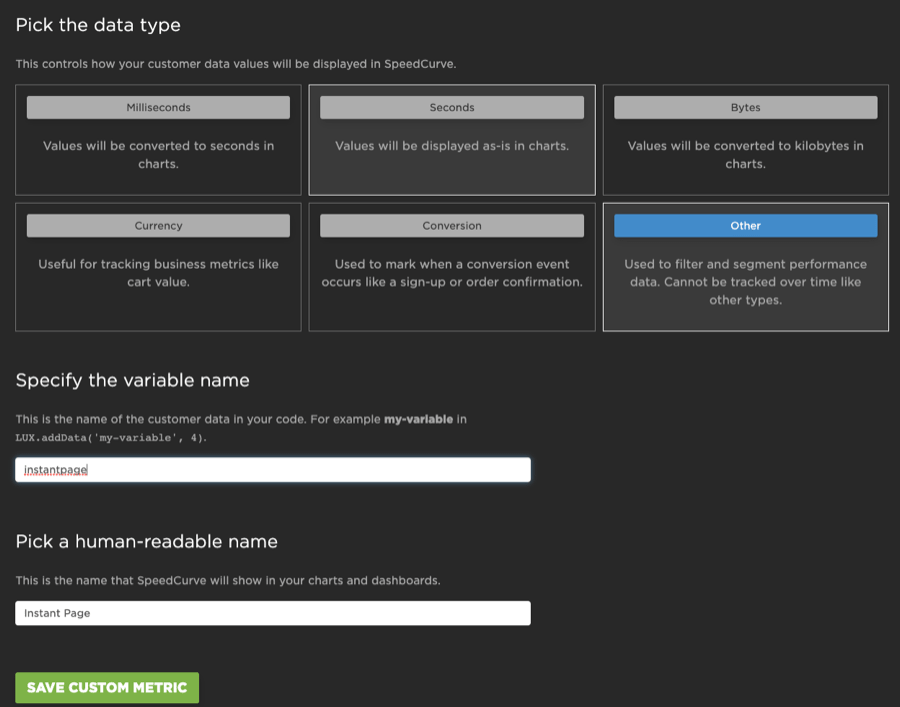
Then, in SpeedCurve, I had to setup the new data variable (using type “Other”) so that I could filter my performance data based on its value.

All that was left was to see if the split testing was actually working. It would have only taken moments in SpeedCurve to see live traffic come through, but I’m an impatient person.
Netlify sets a cookie for split tests (nf_ab) to ensure that all sessions that land on a version of the test stay with that version as long as that cookie persists. The cookie is a random floating point between 0 and 1. Since I have a 50% split, that means that a value between 0.0 and 0.5 is going to result in one version, and a value between 0.5 and 1.0 is going to get the other.
I loaded the page, checked to see if instant.page was loading—it wasn’t which meant I was on the master branch. Then I toggled the cookie’s value in Chrome’s Dev Tools (under the Application Panel > Cookies) and reloaded. Sure enough, there was instant.page—the split test was working.

And that was it. Without spending much time at all, I was able to get a split test up and running so I could see the impact instant.page was having.
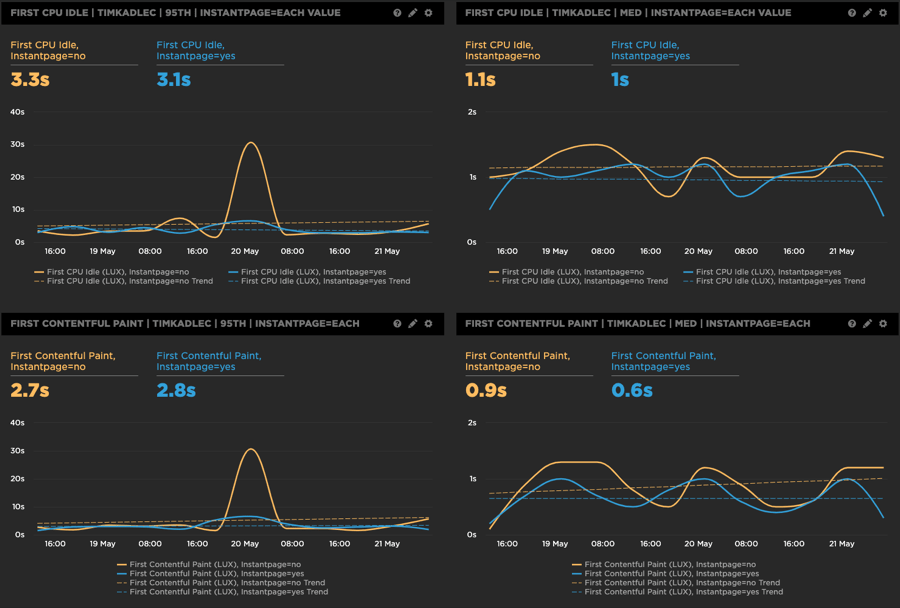
It’s early, so the results aren’t exactly conclusive. It looks like at the median most metrics have been improving a little. At the 95th percentile, a few have gotten a hair slower.

The charts in SpeedCurve so far show promise, though nothing conclusive. First CPU Idle has been 100ms faster with instant page at the median, and 200ms faster at the 95th percentile. First Contentful Paint has been 300ms faster at the median, but 100ms slower at the 95th percentile.
It’s not enough yet to really make a concrete decision—the test hasn’t been running very long at all so there hasn’t been much time to iron out anomalies and all that.
It’s also worth noting that even if the results do look good, just because it does or doesn’t make an impact on my site doesn’t mean it won’t have a different impact elsewhere. My site has a short session length, typically, and very lightweight pages: putting this on a larger commercial site would inevitably yield much different results. That’s one of the reasons why it’s so critical to test potential improvements as you roll them out so you can gauge the impact in your own situations.
There are other potential adjustments I could make to try to squeeze a bit more of a boost out of the approach—instant.page provides several options to fine-tune when exactly the next page gets prefetched and I’m pretty keen to play around with those. What gets me excited, though, is knowing how quickly I could get those experiments set up and start collecting data.