WebPageTest Custom Metrics with Request Data
The other day I tweeted about how much I love snippets in developer tools. If you’re not familiar, snippets allow you to save little bits of code that you can then quickly run in the console.
In Chrome, for example, once a snippet is saved, you can quickly execute it within developer tools by hitting Command + P (Control + P on Windows). This brings up a list of all the sources (files requested by the page). If you then type the exclamation mark (!), it will only show you the snippets you have saved.
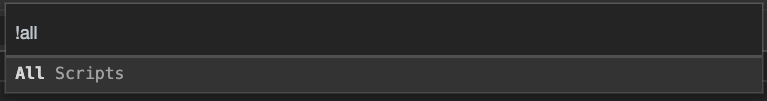
Hitting Command + P followed by ! brings up a list of any custom snippets you’ve defined in Chrome Developer Tools.
From there, it’s a matter of selecting the one you want and pressing Enter. That will open up the console and execute the snippet.
I use this for quite a few tasks, but the example I tweeted was a little snippet that grabs all the script elements on a page and then outputs their src, async and defer values to the console using console.table. It’s a pretty handy way to quickly zero in on the various scripts in a page and see how they’re loaded.
let scripts = document.querySelectorAll('script');

let scriptsLoading = [...scripts].map(obj => {
 let newObj = {};
 newObj = {
     "src": obj.src,
     "async": obj.async,
     "defer": obj.defer
 }
 return newObj;
});
console.table(scriptsLoading);
One thing to keep in mind is that the results are all scripts: those that were included in the initial HTML as well as those that were later injected. Andy mentioned that he wished there was a way to see how many scripts were included in the initial HTML versus injected later on, specifically as part of a WebPageTest run.
WebPageTest supports custom metrics, which are pretty much what they sound like: they’re metrics that you define when you run a test. You provide the logic for the metrics using a snippet of JavaScript.
For example, you could return a custom metric called “num-scripts” by dropping the following in the “Custom” tab on WebPageTest.
[num-scripts]
return document.querySelectorAll('script').length;
The challenge that Andy noted is the same here as in-browser tooling—the document is going to include both scripts loaded by default and scripts that are later injected. If you want to see only the scripts included in that initial HTML, then it’s much trickier.
Pat saw the discussion, and being the wonderful human being he is, he quickly exposed a way to get ahold of an array of all request data for a page (for any tests run on Chrome) using string substitution. Now, a custom metric can refer to either $WPT_REQUESTS, which will be substituted with an array of all request data except for the response bodies, or $WPT_BODIES which will be substituted with the same array, only with the addition of the response bodies for each request.
Having access to raw request data opens up a ton of possibilities, but in this particular situation, we’re interested in the response data. With the response data of the initial HTML request in hand, we can distinguish between what scripts get included in the original markup and which scripts are dynamically inserted.
The following custom metric snippet sets up two custom metrics: num-initial-scripts and num-total-scripts.
[num-initial-scripts]
let html = $WPT_BODIES[0].response_body;
let wrapper = document.createElement('div');
wrapper.innerHTML = html;

return wrapper.querySelectorAll('script').length;

[num-total-scripts]
return document.querySelectorAll('script').length;
The second custom metric, num-total-scripts, should look familiar—that grabs how many script elements appear in the final version of the document, after the page has been loaded and all JavaScript has run.
The first custom metric, num-initial-scripts, counts the number of script elements in the initial HTML. First it grabs the body of the first response using the $WPT_BODIES placeholder. Since that returns a string, we then convert it to HTML so we can parse it more easily. Finally, once we have HTML, we query it as we did the original document.
These metrics would now be available through WebPageTest’s JSON results, as well as being displayed on each test run on WebPageTest itself.
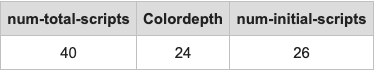
Our two custom metrics are now displayed in the metric summary table for each run of our test on WebPageTest
It’s pretty darn nifty! (That’s what the kids are saying these days. Right?)
We could take this a step further and find out how many external scripts are included in the initial HTML without using async or defer by filtering out any scripts where neither of those values are true:
[num-blocking-external-scripts]
let html = $WPT_BODIES[0].response_body;
let wrapper = document.createElement('div');
wrapper.innerHTML = html;
let scripts = wrapper.querySelectorAll('script[src]');

return [...scripts].filter(obj => obj.async == false && obj.defer == false).length;
Or check how many external stylesheets are included in the HTML that are likely render blocking by finding all stylesheets that aren’t being marked as for print:
[num-blocking-css]
let html = $WPT_BODIES[0].response_body;
let wrapper = document.createElement('div');
wrapper.innerHTML = html;

return wrapper.querySelectorAll('link[rel=stylesheet]:not([media=print])').length;
Or, breaking away from the HTML for a minute, we could check to see if there were any stylesheets being included using @import from within another stylesheet (a performance no-no):
[css-imports]
let requests = $WPT_BODIES;
let cssBodies = requests.filter(request => request.type == "Stylesheet");
let re = /@import/g;
let importCount = 0;
cssBodies.forEach((file) => {
        importCount += ((file.response_body || '').match(re) || []).length;
    }
)
return importCount;
Those are a few quick ideas of data that would have been difficult (if possible at all) to gather before. It’s a pretty handy little bit of functionality that I’m really looking forward to playing with more.