Mundane Improvements, Big Impact
I’m always happy when tooling catches up to the problems we have to solve. Sure, you can figure things out through trial and error (and to be honest, a lot of debugging is still very much that, and I don’t think that’s likely to change), but quality tools can help eliminate the guesswork and provide a shortcut of sorts.
Here’s an example.
A couple of months ago, I was helping one company boost its performance online. We addressed plenty of front-end optimizations, but one of the most troubling issues was their Time to First Byte (TTFB).
The cache hit was very low (a topic for another day), and whenever the server had to provide a fresh version of the page, it was taking an unacceptably long time more often than not. This particular company was using Shopify, so it wasn’t a matter of tuning servers or CDN settings somewhere but figuring out what was taking so long for Shopify to render the Liquid templates necessary to serve the page.
Interestingly, the synthetic data was pretty much smoothing over the TTFB issues entirely. Synthetic tests, even properly tuned to match device and network characteristics, only occasionally surfaced the issue. The RUM data made it clear as day (and it was easily reproduced in individual testing).
Looking at the page itself, we noticed a block of JSON data on product pages. This JSON data was very large, providing detailed product information for all the products in the catalog. It added a lot of size to the HTML (anywhere from 50-100kb depending on the page), and we suspected it was a big part of the server delay as well. Just how much of the delay it accounted for, and whether or not it was the primary culprit, we weren’t sure. Trial and error is fine, and often the only way forward, but it’s always nice to have some definitive evidence to guide decisions.
I pinged someone I know at Shopify around this time, and they hooked me up with a beta version of a new profiler they built for analyzing Shopify Liquid rendering times. (The profiler has since been released as a Chrome extension, so it’s a bit easier to get up and running now.) The profiler takes a JSON object of data about how long Shopify spent rendering the Liquid template and then presents that data in the form of a flame graph.
Sure enough, running the profiler showed that the creation of this JSON object was a significant bottleneck—the primary bottleneck, in fact. The image below is from a profile where the template rendering took 3.8 seconds.
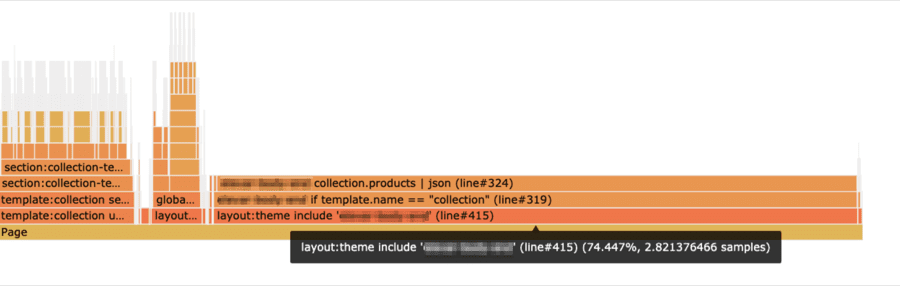
The Shopify profiler shows how much time Shopify spends on each part of a given template. Here, we see including the template that creates a JSON object takes 2.8s.
If you don’t yet speak flame graph, here’s what it’s telling you.
First, on the bottom, is all the work for the Page itself. Everything above that are tasks that had to complete as part of the work to render that page.
The part highlighted, which is showing 2.8 samples (seconds), is the time it took to handle a particular include in the theme. As you move further up the stack, you can see there’s an if statement (if template.name == "collection") that triggers the creation of our JSON object (collection.prodcuts | json).
The width of that final chunk of work to create the JSON object is nearly the same as the width for all work associated with that include, indicating that’s where the bulk of that time is coming from.
We could have put a cap on how many products would be returned in the JSON object, or maybe stripped out some of the data. Either would have made that process faster (and reduced the weight passed over the network as well). We didn’t have to go through the trouble, though. As it turns out, it was for an analytics service the company was no longer using. We removed the creation of the JSON object altogether and watched the TTFB decrease dramatically—to the tune of 50-60% at the median.
From a technical perspective, the optimization isn’t altogether that interesting—there’s nothing super exciting about commenting out a block of JSON. But, to me, the fact that the fix was so boring is precisely what makes it interesting.
The optimization was a huge savings just quietly waiting for someone to find it. If we only had synthetic testing to look at, we would have missed it entirely. As I noted earlier, synthetic tests only rarely showed the long TTFB’s. It took RUM data to both surface the problem, and make it clear to us just how frequently the issue was occurring.
Even after the problem was discovered, identifying the fix required better visibility into the work happening under the hood. Through digging through the completed HTML, we were able to come up with a reasonable guess as to what was causing the problem. But, the availability of a tool with a bit more precision was able to tell us exactly what we were dealing with (and would have no doubt saved us some time if we had it from the beginning).
The combination of quality monitoring and quality tooling is one that tends to have powerful ripple effects. Browsing around Shopify sites, I see a lot of long TTFB issues, and I’m confident that profiling the templates for a few of these pages would surface plenty of areas for quick improvement. If Shopify were also able to find a way to better surface cache hit ratio’s and what exactly is triggering cache invalidation, I suspect a bunch of common patterns would emerge. These patterns would then lead to both individual companies using the platform and likely Shopify itself, identifying changes that would reap huge rewards for performance (and revenue).
It’s not always clever tricks and browser intricacies (though those are always fun) that lead to performance improvements. Often, it’s far more mundane tasks—cleaning up here, adjusting there—just waiting for the right combination of tooling and monitoring to make them apparent.